Intersection Webinar Recap: The Early Childhood Landscape: Centralizing Data for a More Complete Story
February 15, 2020

As policymakers and advocates look to build and strengthen early childhood systems in their states, there are many questions they must consider: What programs are currently provided by my state? How many families benefit — and how many need access but aren’t being served? How much is child care in my state?
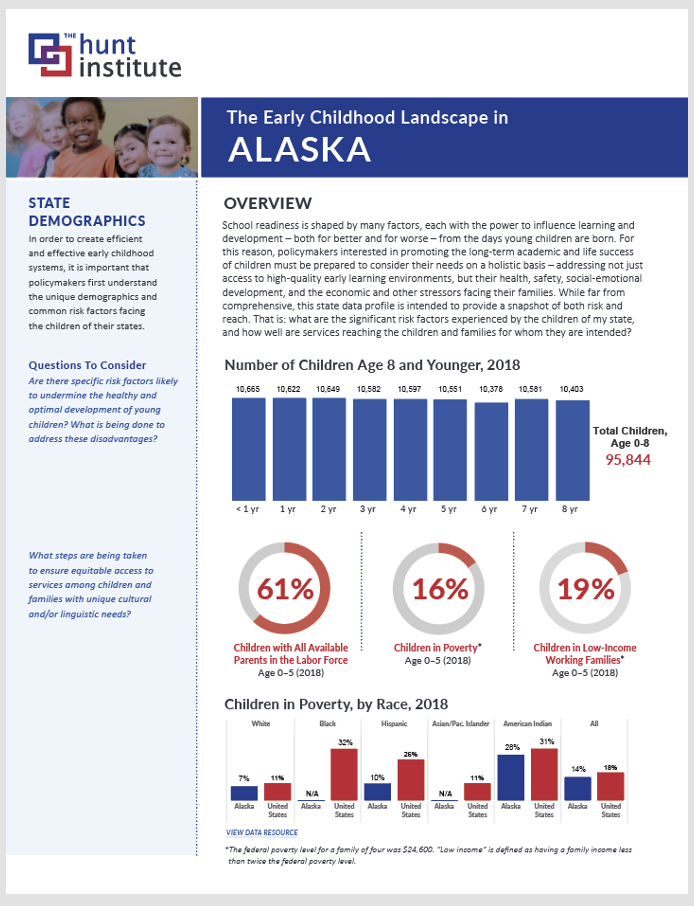
To answer these questions and more, The Hunt Institute recently released it’s 2020 State Early Childhood Data Narratives. These profiles aim to help policymakers better understand their state’s early childhood landscape through a comprehensive analysis of detailed demographic data, service access data, and other information related to state policies for children prenatal to age eight in each state and the District of Columbia. This week, we were joined at the Intersection by The Hunt Institute’s own President and CEO, Dr. Javaid Siddiqi, and Director of Early Learning, Dr. Dan Wuori, to provide an overview of this exciting new resource.
New in this year’s data narratives is a summary of price and affordability of infant care as well as federal expenditures on infants and toddlers, including the number of children served by the Child Care and Development Fund and by Early Head Start. The narratives also include data disaggregated by race and ethnicity, where possible, to allow users to consider the need for focused conversations around equity.
Key Takeaways
- Each data narrative includes detailed statistics, indicators and state policies for infants and toddlers, three- and four-year-olds, and five- to eight-year-olds, including:
- State demographics and common risk factors facing children, including poverty and maternal and child health outcomes;
- Prenatal care and birth outcomes by race;
- Paid family leave and home visiting programs;
- Pre-K trends and state programs; and
- Standards and assessments for kindergarten through third grade.
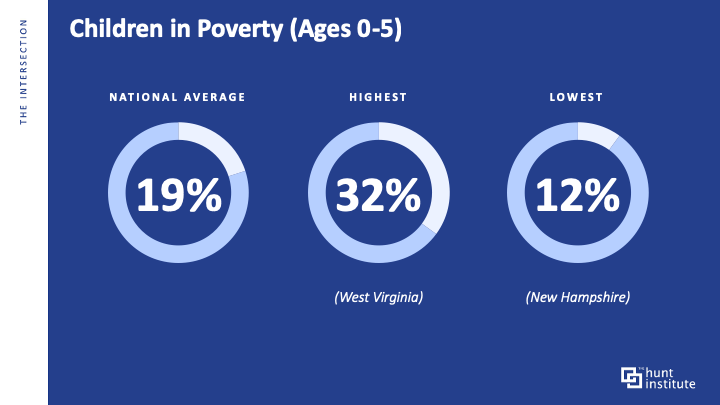
- Approximately one in five American children are living in families under the federal poverty line. This figure can vary significantly by state, with the number of children jumping to roughly one in three in West Virginia (which has the highest rate of poverty for children under five) but drops in New Hampshire (the nation’s leader in this category) to only a little over one in ten.
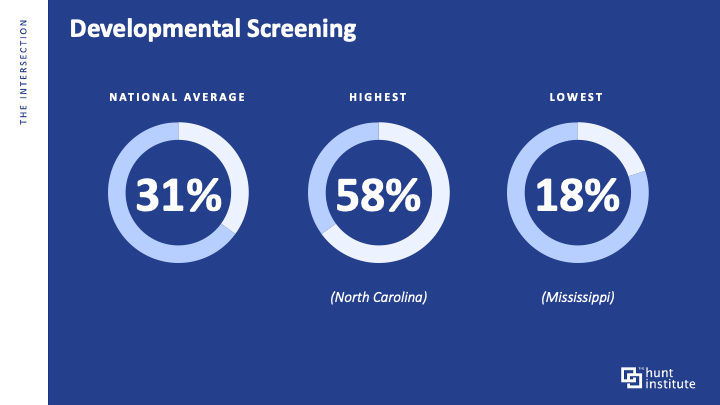
- Throughout the reports, there are indicators that reflect state policy efforts in early childhood education. Among them is the percentage of children participating in developmental screening—approximately one in three students nationally.
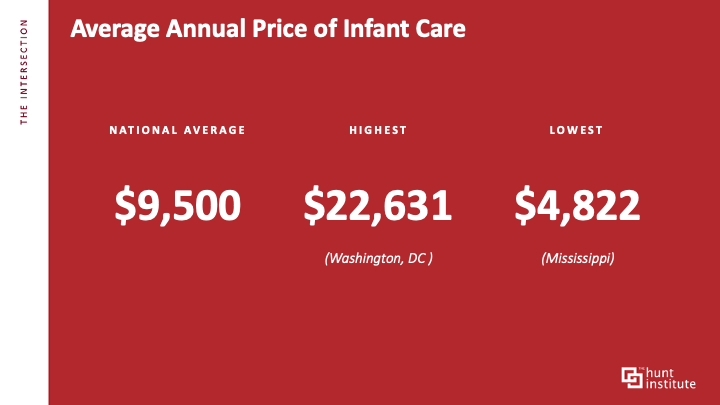
- The average annual price of childcare is just below $10,000 a year, nationally. This cost varies widely, however, with the cost of childcare in Washington DC more than double the national average. This is in contrast to Mississippi where it is approximately half the national average.
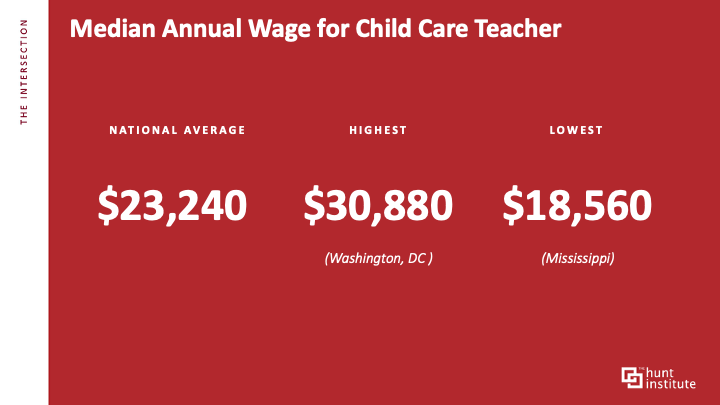
- As a whole, the nation’s child care teachers are poorly compensated with an average annual salary of $23,240. Given these low wages, 53% of the nation’s child care workers received at least one form of public assistance between 2014 and 2016.
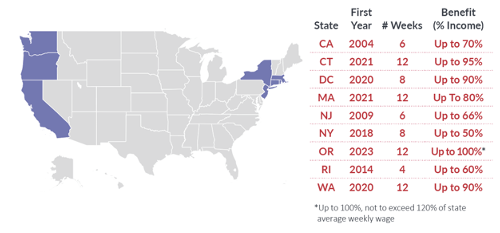
- Nine states (reflected on the map below) have implemented universal paid family leave policies, while eight additional states have enacted paid family leave provisions for state employees only. These are: Arkansas, Delaware, Indiana, Kansas, New Mexico, North Carolina, Tennessee and Virginia.
For our full conversation with Javaid and Dan, please watch the webinar below.

See you at The Intersection!
![]()
The Hunt Team